Spoiler alert - these are the three most prevalent indices used to track and monitor inflation. Before we dive into what these indices track exactly, and how they differ, we need to first understand inflation at a high level.
Essentially, inflation means that, over time, things tend to cost more. A little bit of inflation can be a sign of economic growth, but too much inflation can be bad news for the economy. These indices provide a snapshot of how much things cost and where these costs might be headed. This not only helps us understand the economy but also impacts financial markets.
Consumer Price Index (CPI)
CPI is the most commonly understood inflation measure. It is released by the U.S. Bureau of Labor Statistics (BLS) and measures Americans’ purchasing power by tracking the cost of items over time.
These items are put into what is called the “basket of goods and services,” which consists of a weighted mix of what American’s typically buy - think housing, food, etc. CPI helps determine increases in government benefits like Social Security and food stamps as well as helps adjust Treasury Inflation-Protected Securities (TIPS).
Personal Consumption Expenditures (PCE)
PCE is another key measure of inflation but has a few differentiating factors. It is also released by the BLS and measures the prices that Americans pay for goods and services, but it weights the categories differently. While the CPI tracks about 80,000 products, the PCE includes extra data like government spending, covering almost 100% of the U.S. economy.
Many consider the PCE more accurate because of these differences, and it is used by the Federal Reserve (the “Fed”) when setting monetary policy. It is important to know that the Fed holds a target of 2% inflation which signifies steady economic growth while maintaining price stability.
Producer Price Index (PPI)
With CPI and PCE providing insight from the consumer’s point of view, what about the producers? PPI measures the cost to producers for goods and services and is released by the BLS monthly. It is based on a survey of about 35,000 establishments, which submit roughly 100,000 price quotations each month.
Producers use the PPI to develop pricing strategies and forecast future consumer costs. The government leverages this data to shape monetary and fiscal policies aimed at controlling inflation, keeping it closer to that 2% target.
Together CPI, PCE, and PPI can help paint a picture of inflation in the U.S. They’re not just another statistic or financial indicator; these indices are key indicators that the Fed uses when setting interest rates, which can have a major impact on financial markets. They are essential tools in the investor’s toolkit.
Source: https://www.schwab.com/learn/story/tracking-inflation-using-cpi-pce-ppi-indexes
Now that we have a better understanding of the three most commonly used indices to monitor inflation, we can start to see how inflation is integrated into financial plans, and why it’s a critical consideration for retirement planning.
Considerations for Financial Planning: Using different inflation rates is a key stress-test we use to ensure our clients are prepared for various economic environments. A miscalculation in inflation expectations can lead to higher-than-anticipated expenses, which may require an adjustment to the plan.
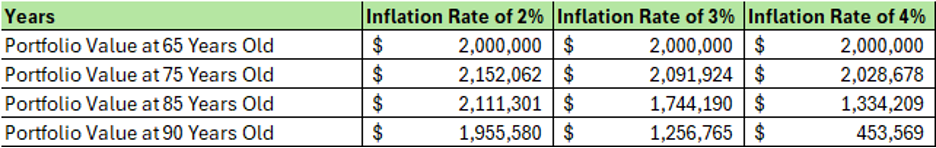
Let’s break this down with an example. Below, we can see how a $2M portfolio performs under different inflation environments —2% (the Fed’s target), 3%, and 4%— over a 25-year retirement. In this scenario, we assume that the individual retires at the age of 65 and earns an average rate of return of 6%. With base, or starting, annual expenses of $100K, we project different inflation effects on the portfolio until age 90.
Key Takeaways:
Now let’s take a deeper look into the annual expenses under different inflation rates. We see the starting annual expenses of $100K increase each year with inflation. If you look at the 2% rate (the Fed’s target) for example, you can see that the same annual expenses of $100K at age 65 will grow to $164K by age 90.
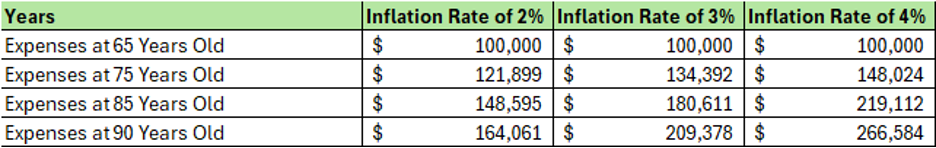
The interesting thing to note, is that the total accumulated expenses over the 25-year period is a million-dollar difference between projecting inflation at 2% compared to 4%. This is why it is crucial to look through different inflation rates and stress-tests as one engages in the financial planning process.
Disclosure:
Green Ridge Wealth Planning, LLC is a registered investment adviser. The information provided here is for general informational purposes only and should not be considered an individualized recommendation or personalized investment/tax advice. The investment/tax strategies mentioned here may not be suitable for everyone. Each investor needs to review an investment/tax strategy for his or her own particular situation before making any investment decision(s). You are responsible for consulting your own investment and/or tax advisor as to the consequences associated with any investment.
The opinions referenced are as of the date of publication and are subject to change due to changes in the market or economic conditions and may not necessarily come to pass. Any opinions, projections, or forward-looking statements expressed herein are solely those of the AUTHOR, may differ from the views or opinions expressed by other areas of Green Ridge Wealth Planning, LLC, and are only for general informational purposes as of the date indicated.